Local-first. Your data never leaves your machine.
Know where your
money goes
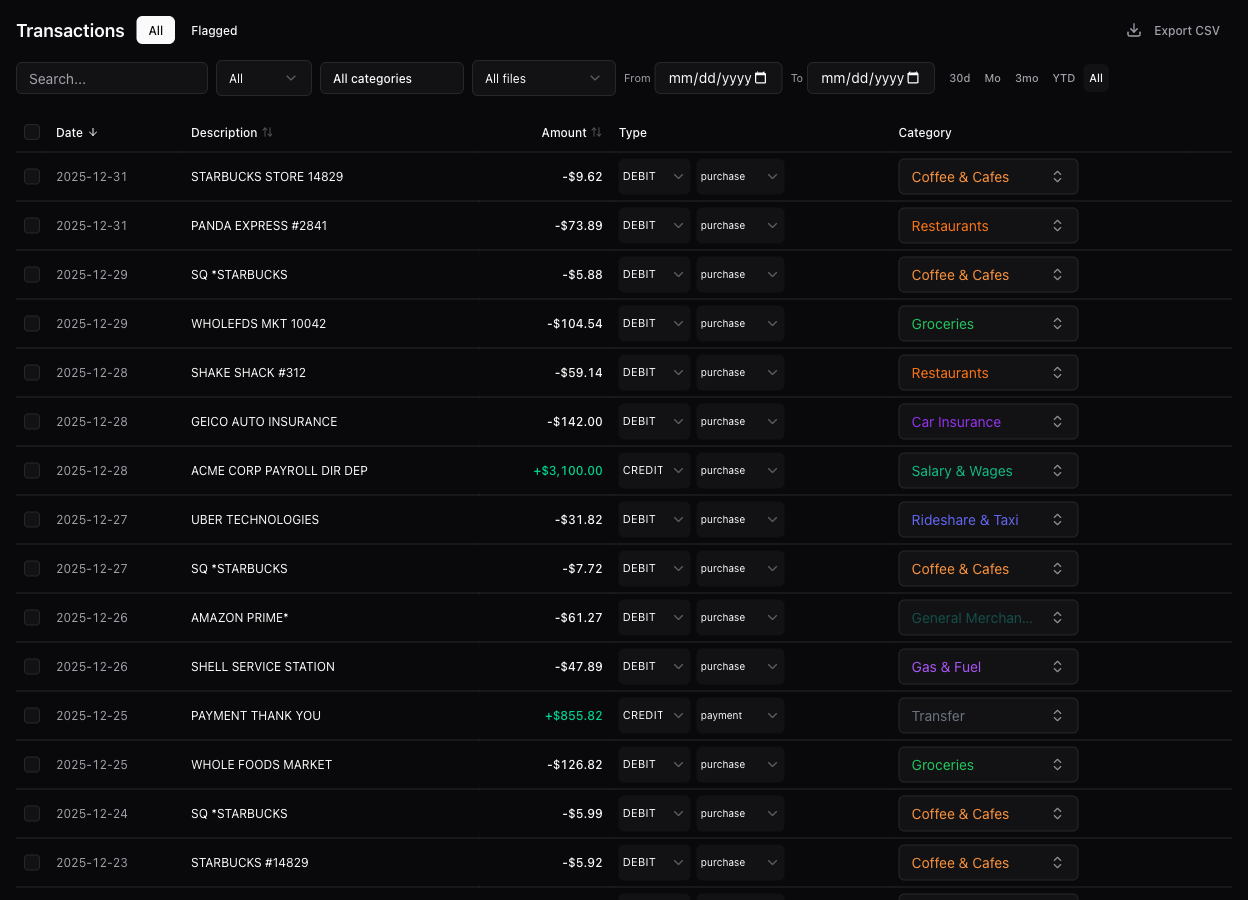
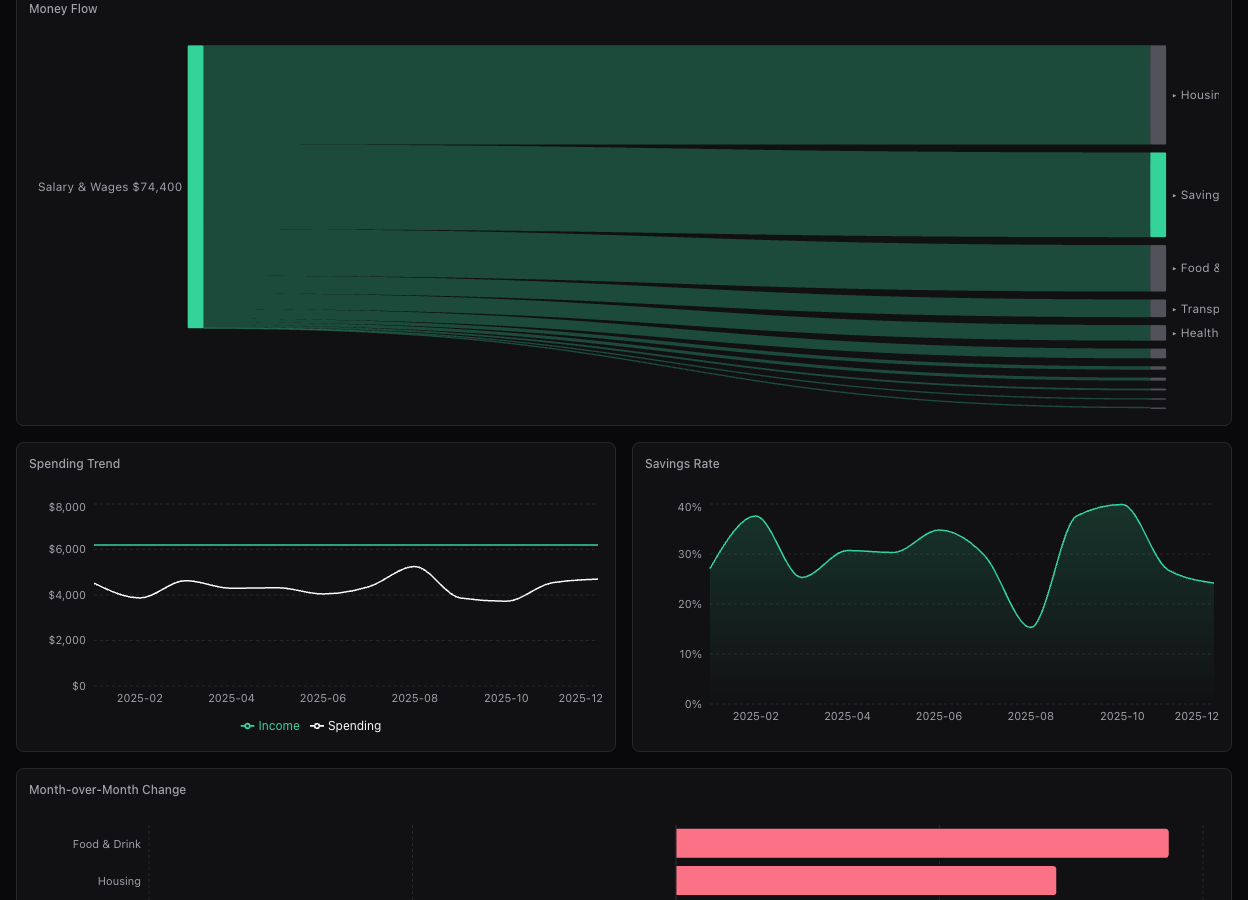
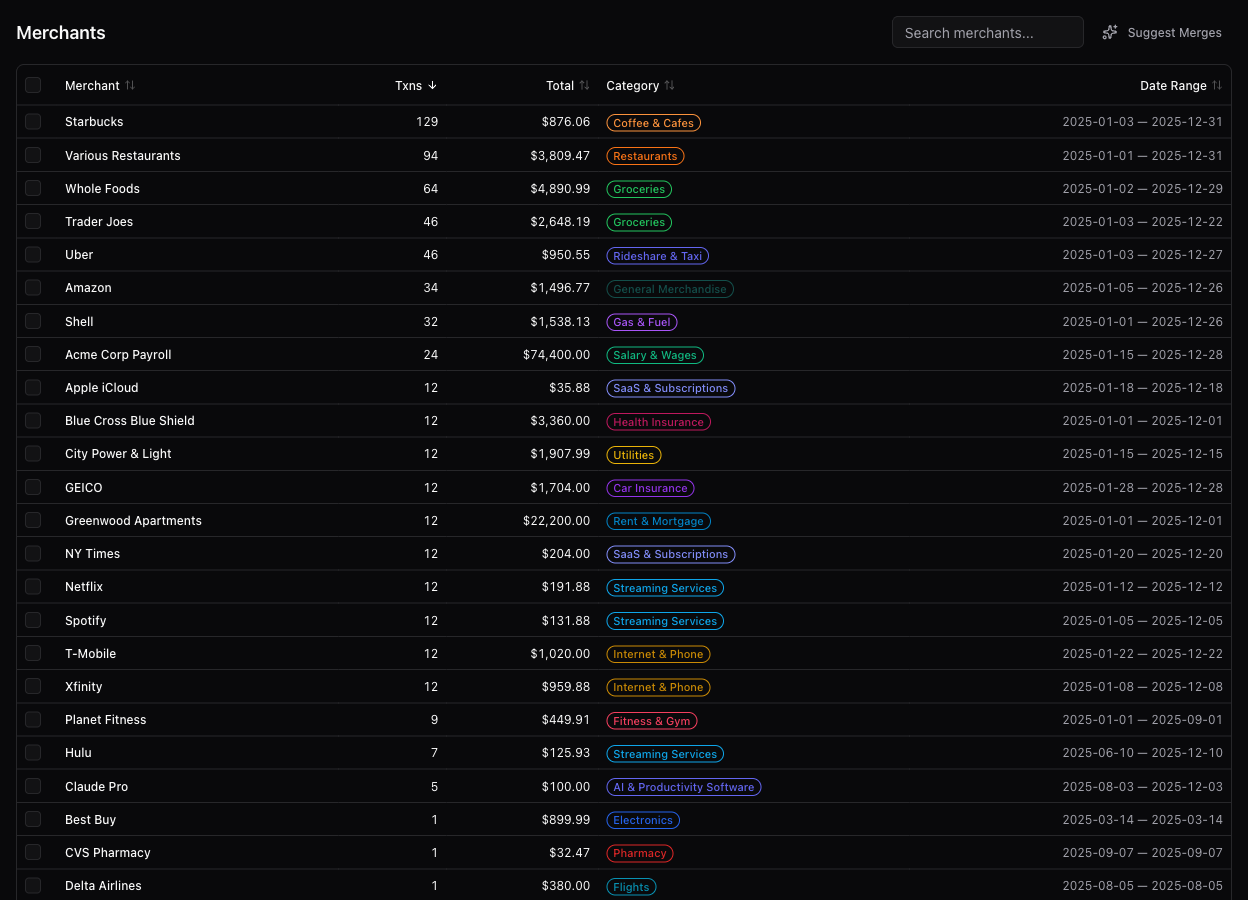
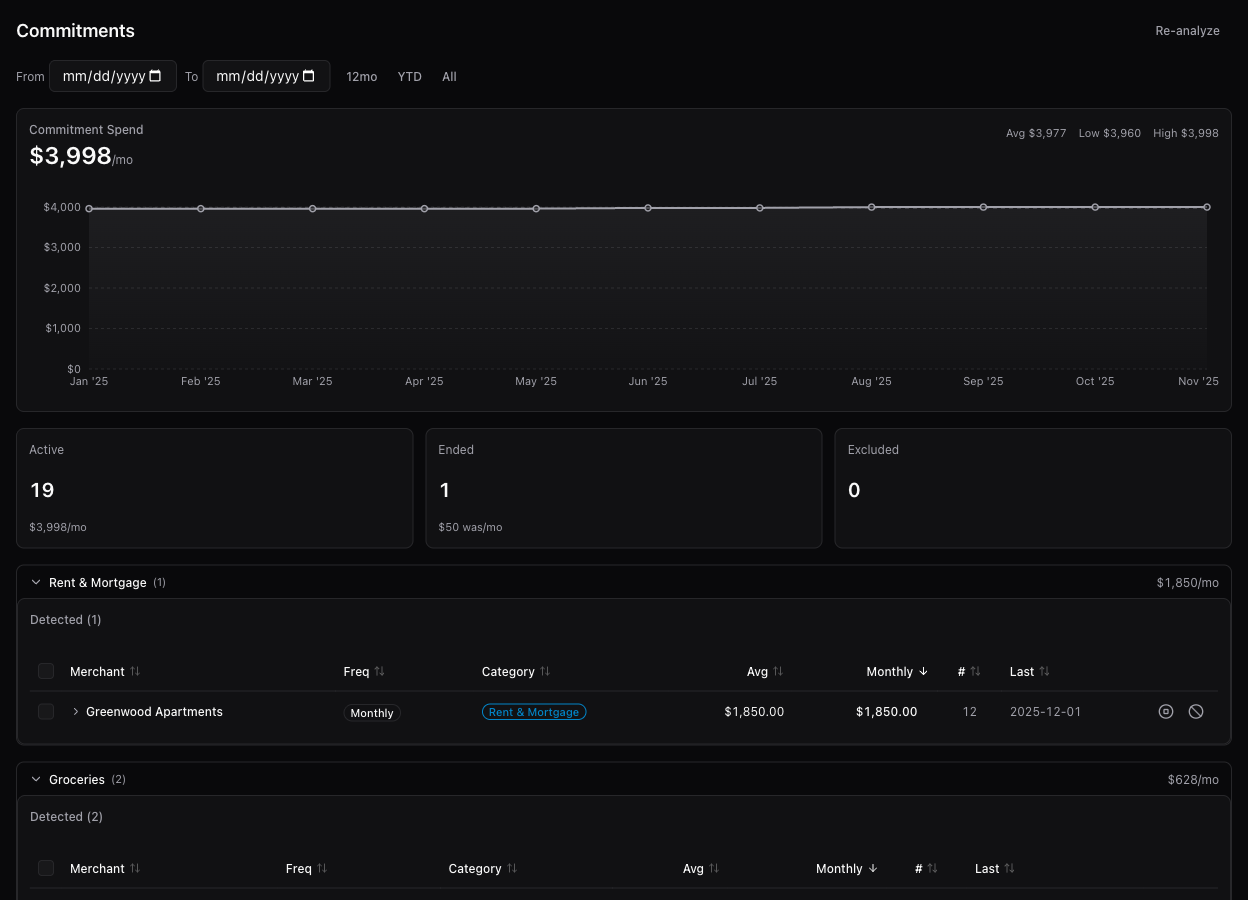
Drop in your bank statement PDFs. AI pulls out every transaction, sorts it, and shows you what's actually happening with your money — all on your machine, nothing uploaded anywhere.